Power BI Learning Opportunity at SQLBits

If you’ve been thinking about learning Power BI, I have a wonderful opportunity for you. I will be presenting, along with my friend and colleague Michael Johnson (Blog | Twitter), a full day of training at SQLBits on 8-March-2022. Our Training Day session is called Zero to Dashboard.

Our session assumes you have no knowledge of Power BI, so if this is your first encounter with Power BI, no worries, we’ve got you covered. We will cover the Power BI ecosystem, talk about the importance of data cleansing and data modeling, introduce visualization best practices, and review governance considerations. We reinforce all these concepts through hands on labs that we go through as a group. By the end of the day, you will be able to create a dashboard. If you are one of those folks who need to do things multiple times before they “stick” (like me), you will walk away with the lab manual used in class so you can go through the labs again to help solidify what you have learned.

SQLBits is a hybrid event this year, so if you cannot attend in person, no worries, you can attend virtually as well. If you are interested in attending, there are still registration slots available, but seats are limited, so don’t wait to long to register.

Michael and I hope to see you there.

Unable to Validate Source Query in Tabular Editor

I recently encountered the error, “Unable to validate source query” when trying to refresh the metadata for the tables in my tabular model using Tabular Editor. I immediately googled that at came up with a great post by Koen Verbeeck (Blog | Twitter). I had never seen this error before and since my metadata refreshes had been working flawlessly for weeks, I was so excited when I found this post.

Long story short, this post did not help me. I tried everything suggested, I ran my partition queries wrapped in SET FMTONLY ON and they came back instantaneously in SSMS. I added the TabularEditor_AddFalseWhereClause annotation from this thread. Neither worked. So wasn’t quite sure what was going on.

My last-ditch effort was to add a new table to my model to see if I was even getting a successful connection to my data source. I was prompted for the password, which it had not done before when adding new tables or refreshing table metadata (for weeks). I was using a legacy data source (Azure SQL Database) w/ SQL Server Authentication. Once I supplied the password, I could see a list of available objects in my database. I cancelled out of the new tables dialog and clicked Refresh Table Metadata and winner-winner chicken dinner, no more “Unable to validate source query” error. Turns out my password “mysteriously disappeared” from my connection string.

The moral of the story is: It’s not always zebras when you hear hoofbeats, sometimes it is horses.

Hopefully, this post will help someone else waste significantly less time than I did on fixing this error.

I’m Speaking at #DataPlatformDiscoveryDay

We are living in some very interesting times and the technical conference community is facing some challenges like it never has before.  So many in-person events have been postponed or cancelled.  For those who are speakers, like myself, this have been very challenging.  I have worked from home for over eight years, so the new “norm” is just the same old same old for me.   But I used my speaking engagements as a way to connect with others in the tech community on a fairly regular basis.  Now that this has been put on hold for who knows how long, I’m having a tough time staying connected.

I am very fortunate that I work in an area that is still very much in high demand and still employed, unlike many others who have been furloughed or laid off.  With so many people unemployed now more than ever in the world, many of those folks are contemplating a career change.  Thankfully, I have a fellow Data Platform MVP in the US who has partnered with a colleague in Europe to bring a new kind of tech conference to those who are looking to break into the data platform arena.  Oh, and it’s virtual – and it’s free! So you don’t have to leave your home and if you are on a tight budget, you don’t have to spend a thing.

I am so honored to have been selected to speak at this first of it’s kind, beginner-virtual-free conference, Data Platform Discovery Day.  I will be presenting my What is Power BI session, so if you’ve ever wondered about Power BI and have some free time on your hands, then come join me on Wednesday, April 29, 2020.  There are lots of great introductory sessions out there, here’s the US sessions list and the European sessions list.  There’s still time to register for the US Sessions or register for the UK sessions.

I hope you are all doing well and staying home and staying safe.

I’m Speaking at #SQLSatSpokane

I am super excited to announce that I have been selected to speak at SQL Saturday Spokane on March 21, 2020.  Not only have I been selected to speak, but I’ve been selected to give a pre-con on Friday, March 20, 2020 as well.

I will be delivering my Power BI Zero to Dashboard pre-con.  This is a full day introductory session to Power BI that focuses on: introducing the Power BI eco-system, what it can and cannot do for you; the importance of data cleansing and modeling;  and data visualization best practices.  My target audience is those that have little to no experience with Power BI, but want to learn more.  If this sounds like something you could benefit from you can Register Here.

I will also be delivering my What is Power BI? session on Saturday, March 21, 2020.

If you’re in the Spokane area on Saturday, March 21, 2020, stop by and say, “Hello”.  I’d love to see you and chat.  There are still registration slots open, so register now.

Updated Data Profiling in Power BI Desktop

In this month’s (October 2019) release of Power BI Desktop, they have added a ton of cool stuff, you can read all about it via the Power BI Blog.  But what I’m most excited about is the love that was given to the Data Profiling feature.

The Data Profiling feature was first added to public preview just under a year ago in November 2018.  Then it went GA in May 2019 and just 5 months later, they’ve added more goodness.  That’s one of the great things about Power BI, the release cadence.  If you don’t like something or want more features, just wait a few months (or five in this case).

One of the big things that was lacking with the Data Profiling feature was the text length statistics.  This is a huge deal for me.  It’s one of the things that I’ve encounter most frequently, incorrectly sized string columns in data warehouses.  Well, the wait is over, text lengths are now available.  Unfortunately, it’s not intuitive on how to get them.

First, you will need to make sure that you have the Column profile check box checked in the View ribbon in the Power Query Editor window.

Now select a column of data type text so the Value distribution pane (at the bottom of the screen) shows the values of the column.  Then click on the little tiny ellipses (…) in the upper right hand corner of the Value Distribution pane.  Select Group By then Text length from the pop up menu.

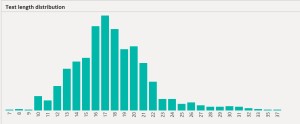
Now you should have a nice histogram of your text length values.

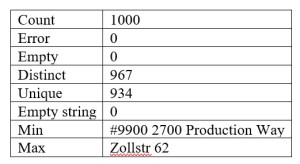
This is much better than nothing, but I wish they would have included the Min and Max lengths in the Column statistics pane with all the other summary statistics because it has a nice little Copy menu (via the ellipses in the upper right hand corner) so you can easily send the data to someone in an email if needed.  They even formatted the output in a table!

Contents of Column Statistics Copy
Contents of Column Stats when pasted into Word

The Group by functionality isn’t just for text data types though.  You can use it for all data types.  I really like the groupings available for Date and Datetime data types, these will be super helpful.

Available Date groupings

Available Datetime groupings

Honestly I’m not trying to look a gift horse in the mouth, but we still need more when it comes to text lengths.  So I’ll just wait a few months and see what comes next.


Using Power BI To Track My Activities

As a MS MVP one of the things you have to do is keep track of all the “things” you do for community, whether it be volunteering, organizing, speaking, etc.  It can be a bit daunting trying to keep track of all of it.  But hey, I’m a Data Platform MVP, how hard can it be to keep track of data?!  Queue music from one of my favorite Blake Edwards movie .. Pink Panther.

At first I was just keeping track of everything in a text file via Notepad.  That got very unmanageable very quickly with all the different kinds of things I was doing.  I migrated all my data to a spreadsheet, because we all know that Excel is the most popular database in the world, right?

I knew that I had been busy in 2018, but I had no idea until I used Power BI to look at my data.  Yes, I was significantly busier in 2018 than I ever had been and 2019 is shaping up to be just the same if not busier.

Take a look at what I created.  It was a fun project to work on and allowed me to explore some things in Power BI that I don’t work with on a regular basis.  Let me know what you think.

Speaking at SQL Saturday Victoria

I am so excited to announce that I have been selected to speak at SQL Saturday Victoria on Saturday, March 16, 2019. I will be presenting my What is Power BI session.

This is another kind of homecoming for me.  When I was a kid, my sister & I lived with my grandparents for a while down in the Willamette Valley and we used to go to Victoria every summer.  I have very fond memories of Butchart Gardens and walking around The Land of the Little People.  I was super bummed when I found out that the latter no longer existed.  But if you have time, I would highly recommend Butchart Gardens and yes, they are open in Winter.

If you’re in the area, stop by and say, “hello”.  I’d love to see you and chat a while.

How To Use Power BI Embedded For Your Customers

Recently I had a need to build a Power BI report for a client.  This client has a multi-tenant database and their own custom web app.  They want to show each client their data without showing any other clients’ data. They also don’t want to require their customers have a Power BI license.  Easy enough, just use Power BI Embedded with the App Owns Data model and set up Roles (row-level security) in the Power BI Desktop file, should take less than five minutes to set up.  Well, we all know it took longer than five minutes or this blog post wouldn’t exist.

There are some great tutorials from Microsoft out there, they even provide a sample app on Github that you can download if you are not a web developer (I am so NOT a web developer!) to help you get started.  There are some great blog posts about it too, one from Reza Rad and one from Kasper de Jonge.  So why I am writing yet another blog post about it?  Because the devil is in the details, and I completely missed the details which means someone else must have as well.

I don’t want to repeat what others have already written, so go ahead, go read their posts, it’s okay I’ll wait here.

Now that you familiar with Row Level Security in Power BI, how do you make it work when you want to pass in your customer’s identifier because your customers don’t have Power BI accounts?  It seems like the only way to make dynamic row level security is to use the Username() DAX function?  But wait, doesn’t that require the user to have a Power BI account?  Sigh, it seems we are going in circles.

The one thing these articles don’t talk about is that when you are using Power BI Embedded, you can pass in whatever you like for the EffectiveIdentity via the Power BI API and it will “overwrite” the Username() function.  What?!  That’s right, it will completely ignore the Username() function and use whatever you give it.  WooHoo!

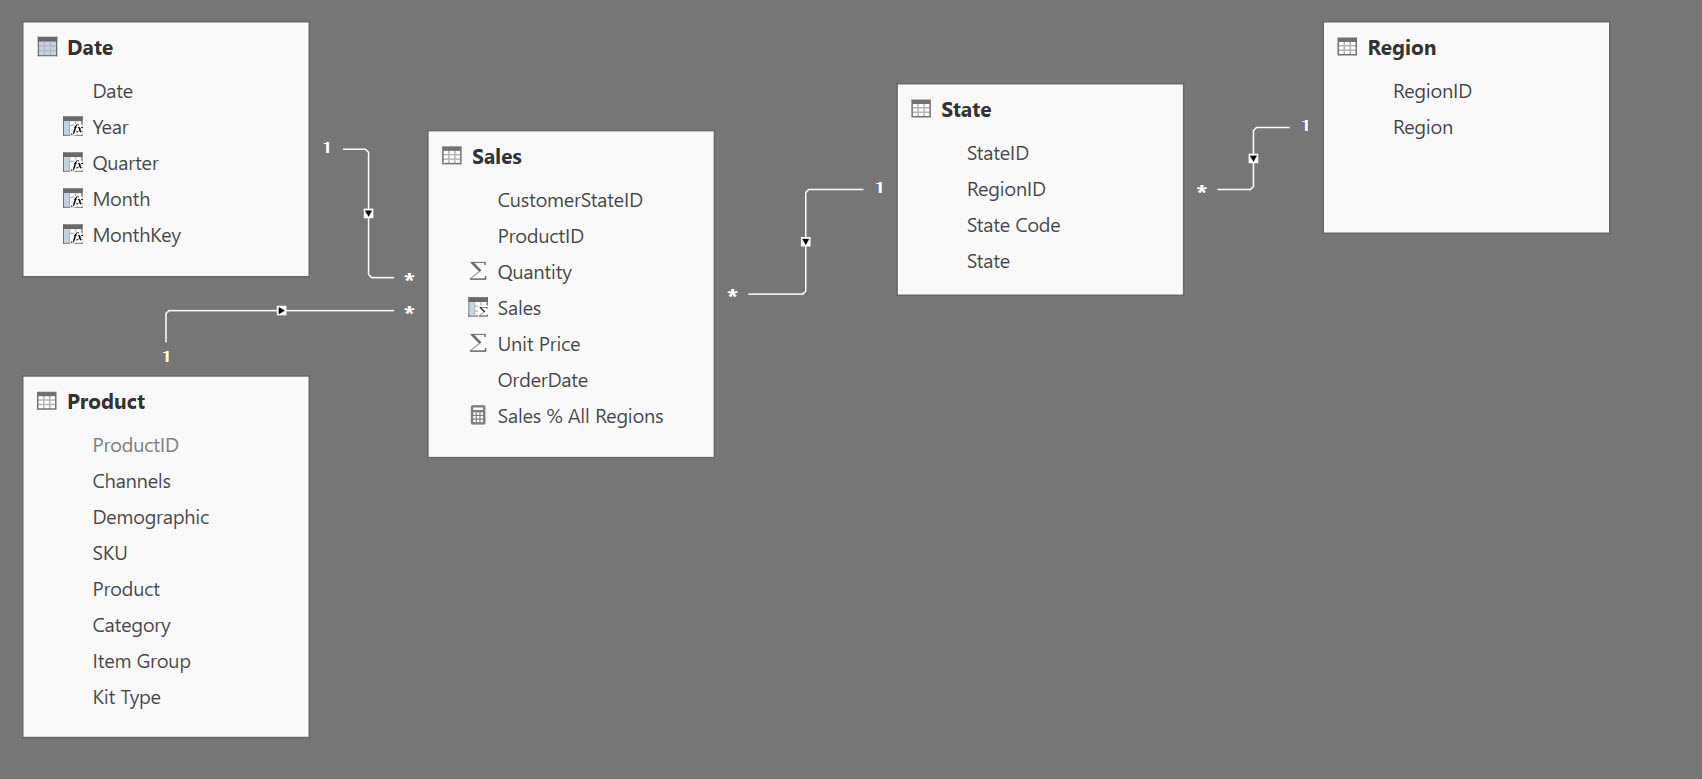
Let’s see an example, so it’s crystal clear.  I have a small sample of data that has some sales.

Embedded-Sample-Relationships

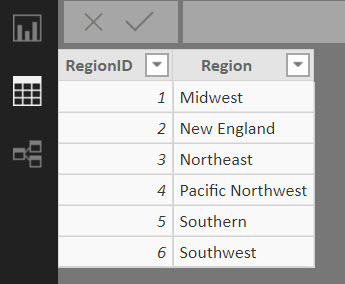
Let’s say I want to limit the view of the data by Region.  Here are my available regions.

Embedded-Sample-Regions

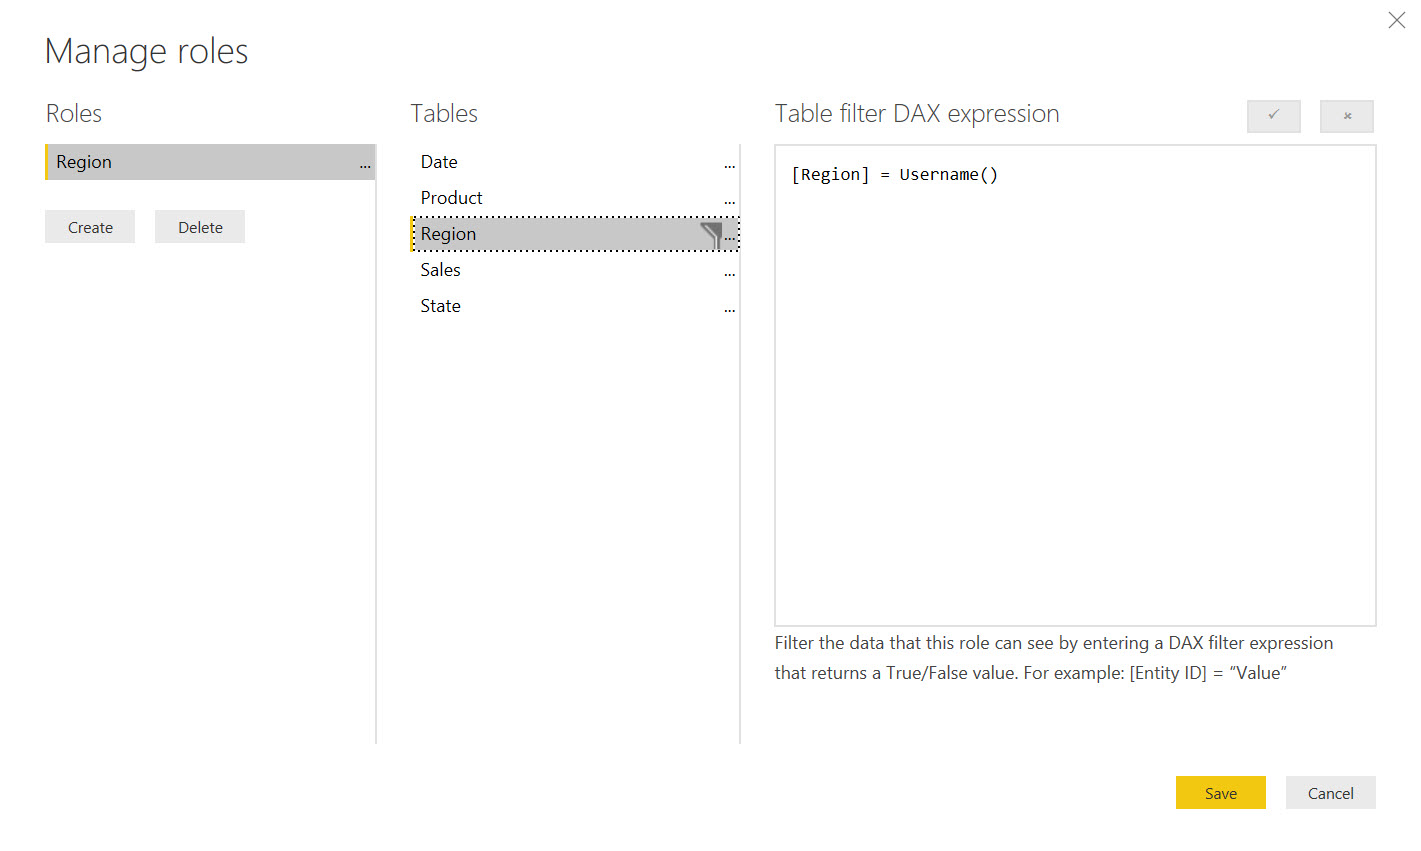
I would need to create a role based on Region that looks like this

Embedded-Sample-ManageRoles

Notice that I am using the Username() Dax function for Region.  I know, I know, my customers aren’t Power BI users, so this makes no sense, why would I use this?  Like I said earlier, the value that you pass via the Web API as the EffectiveIdentity will overwrite the Username() function.

Now that I have my Roles set in my Power BI Desktop file, I can publish my file to the Power BI service.  All that’s left to do is to add members to my role.  Now when using Power BI Embedded in this scenario, you only need to add one account to the role that was just created.  Just keep in mind that this account must be have a Power BI Pro license.

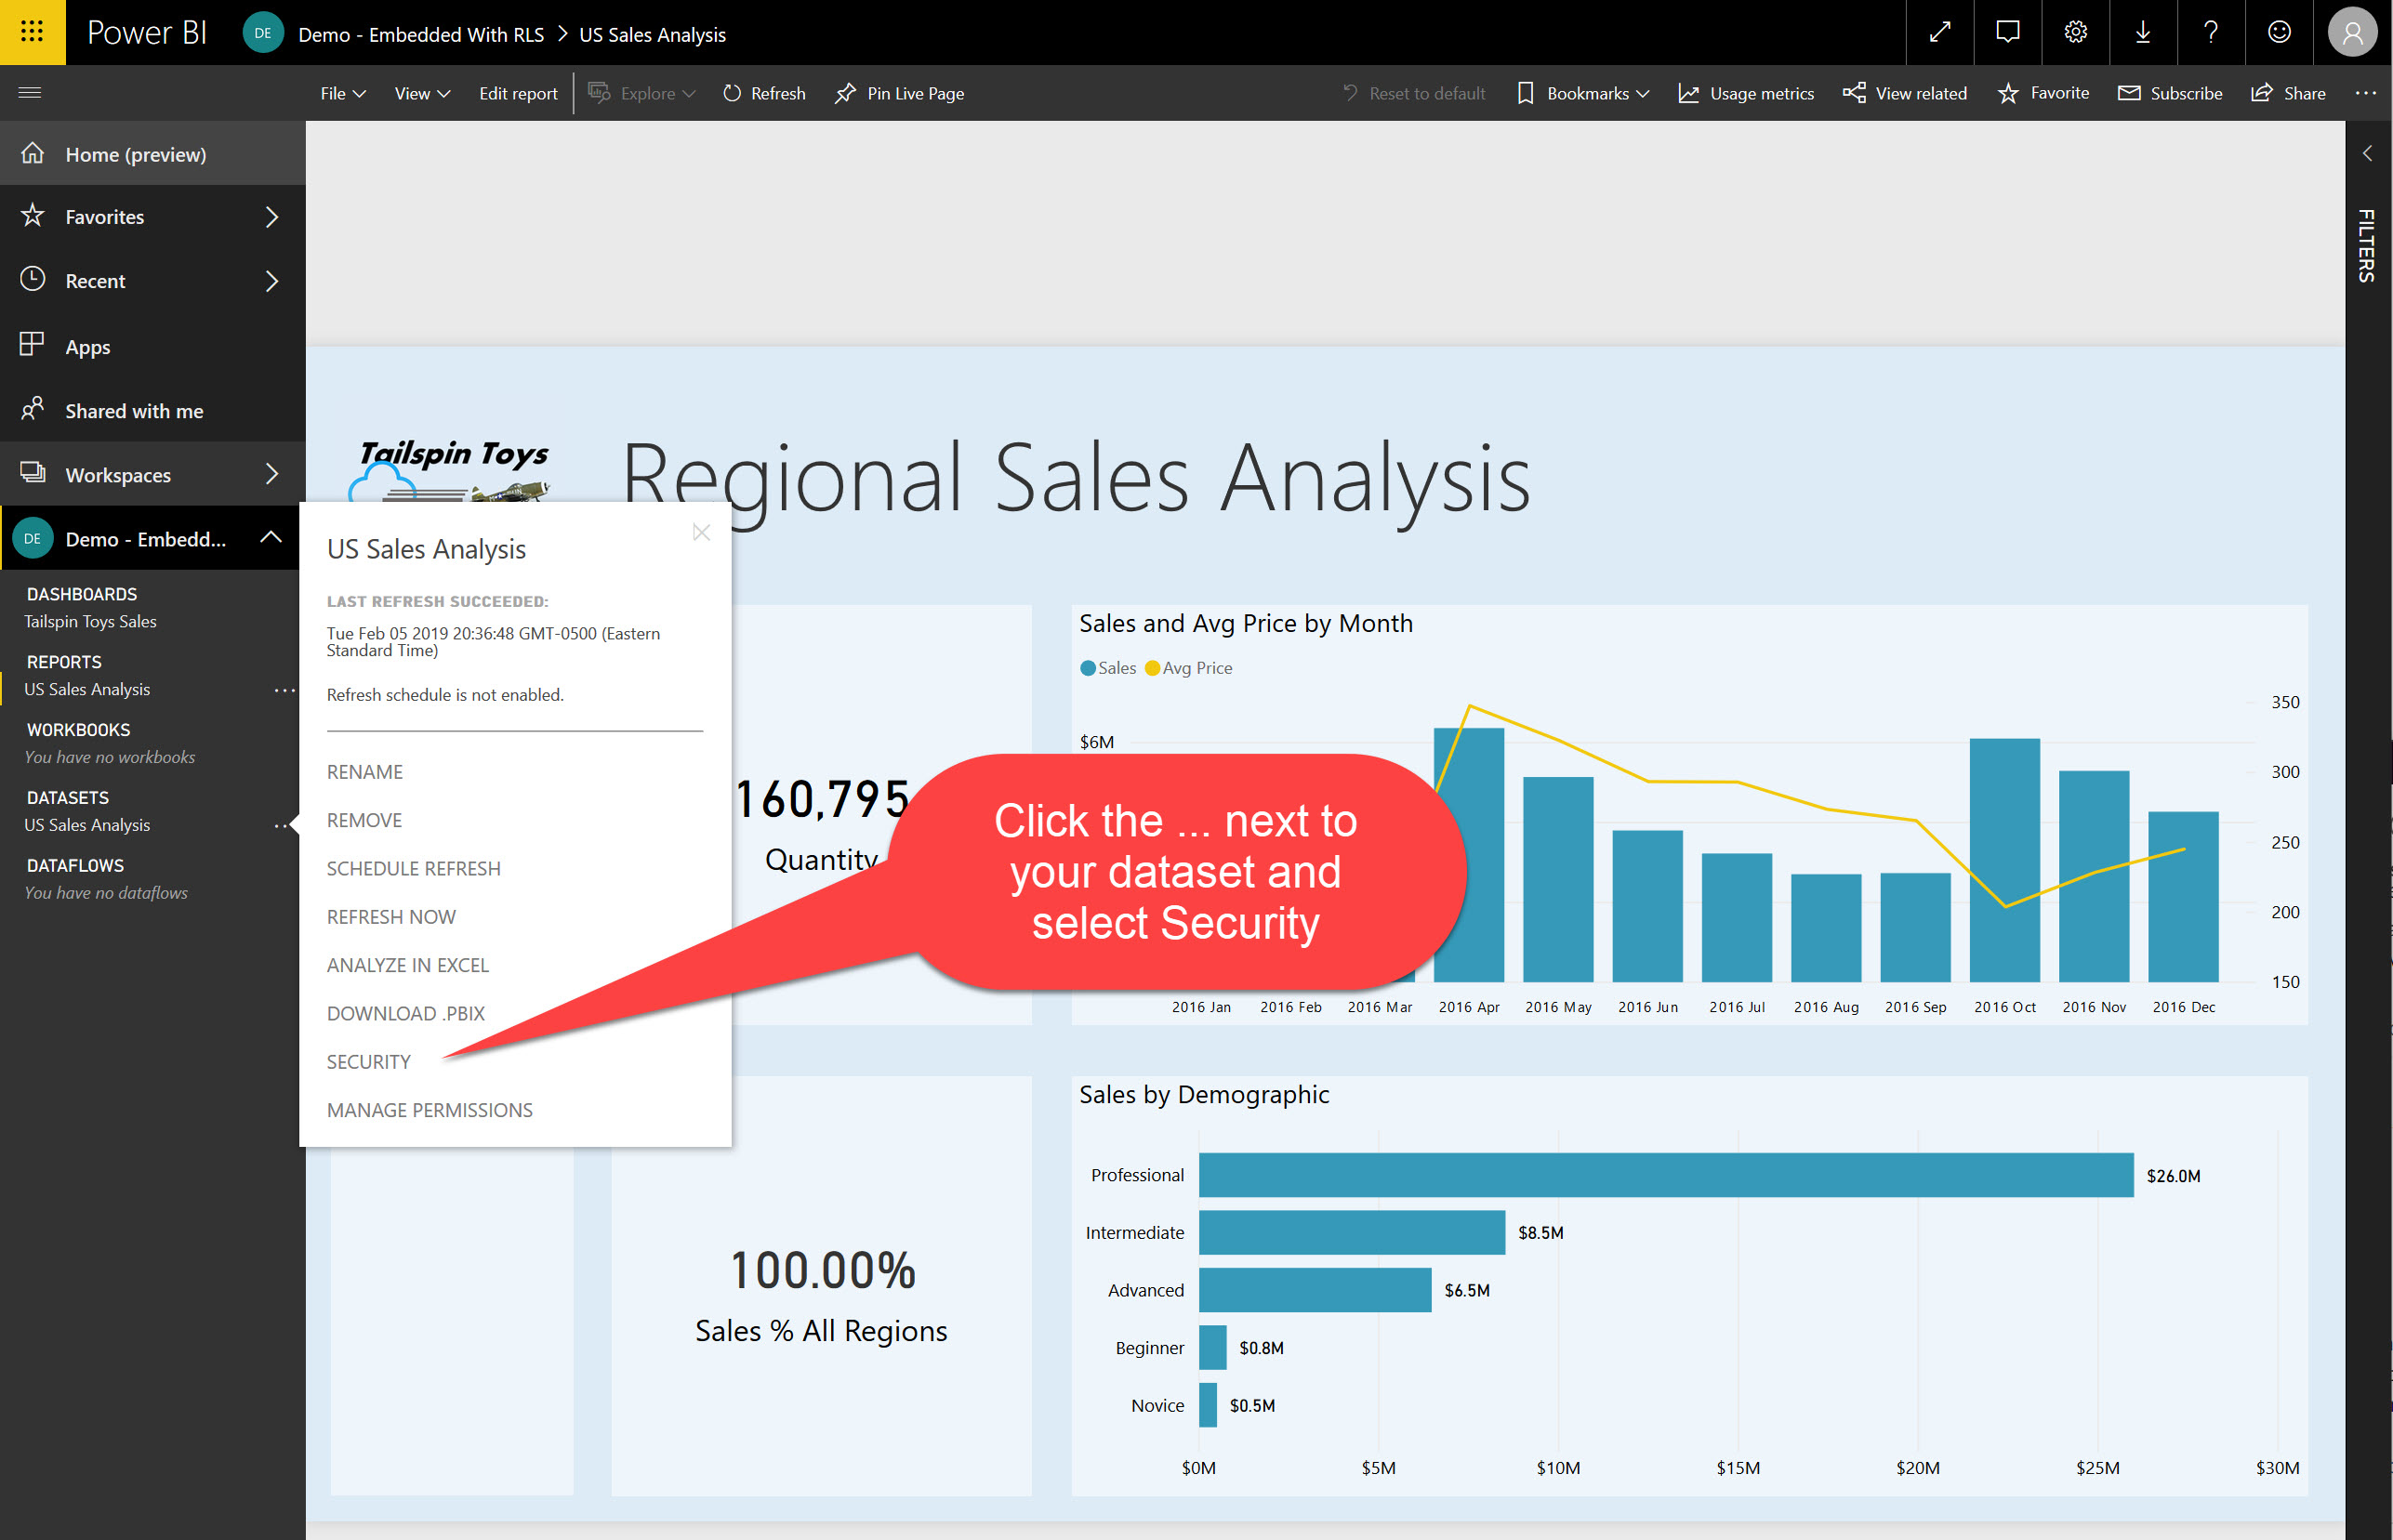
Navigate to the Security for the dataset.

Embedded-Sample-Navigate-to-Security

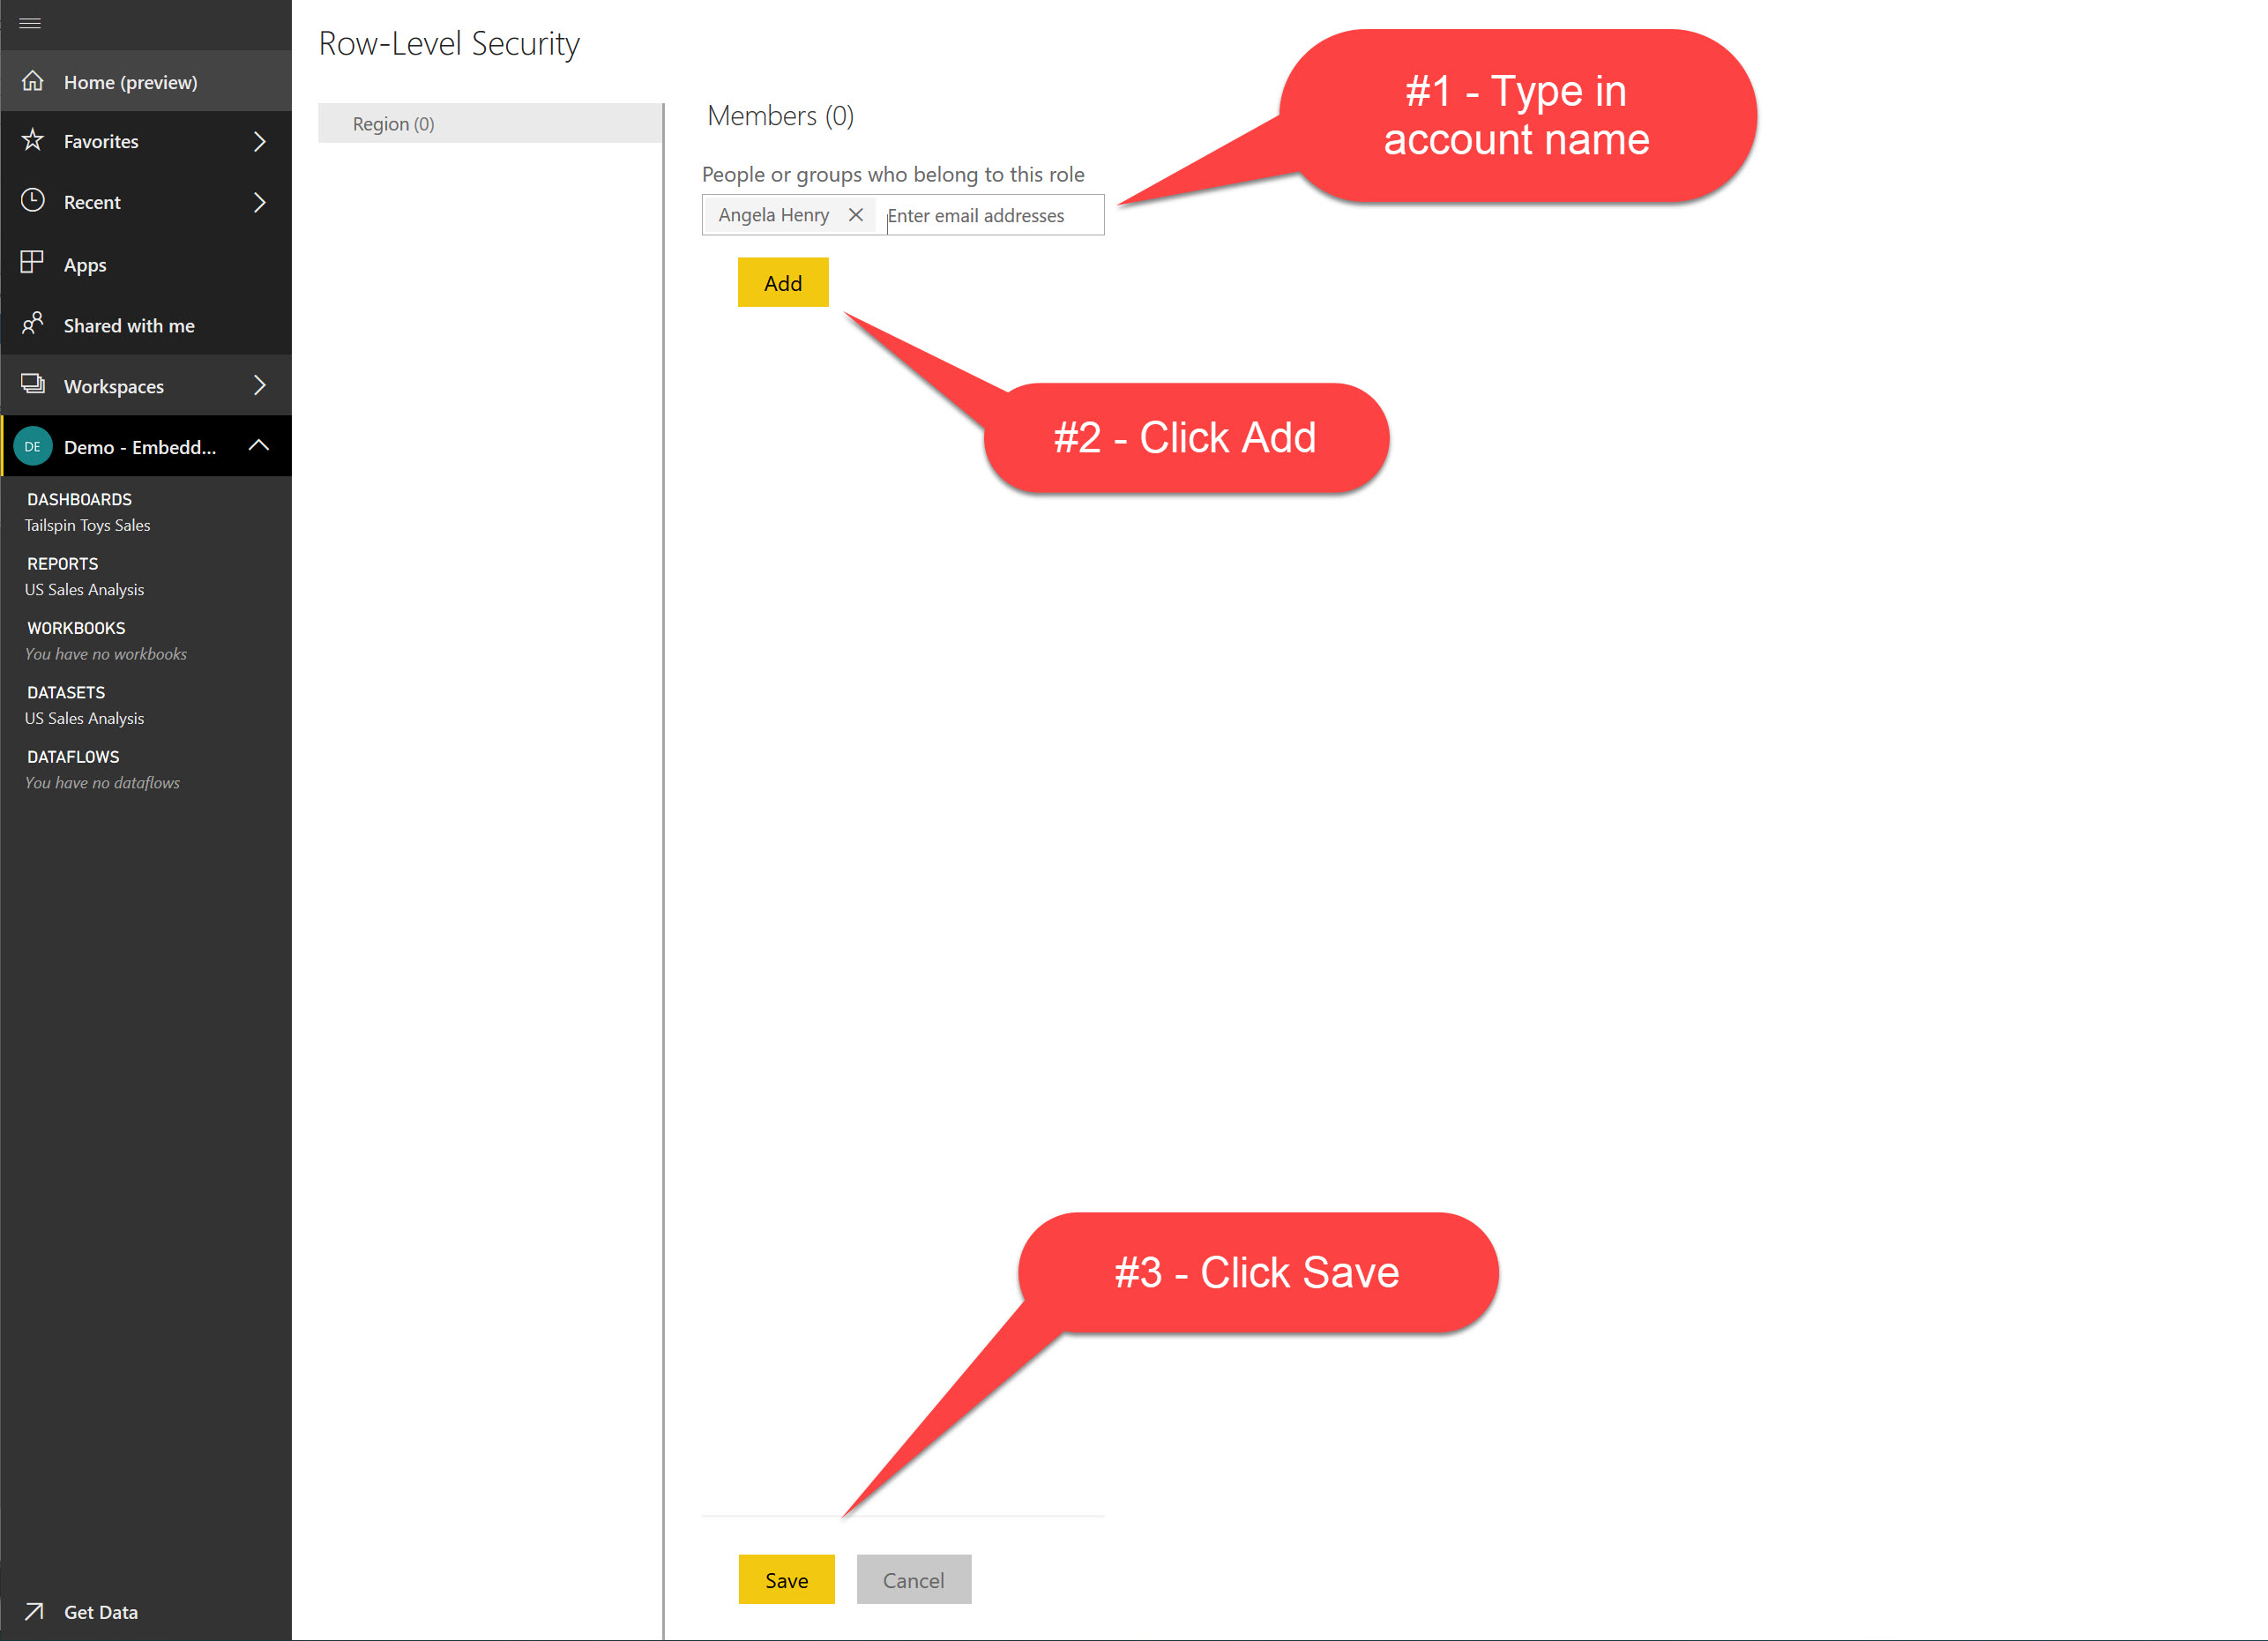
Add your user to the role

Embedded-Sample-Add-Account-To-Role

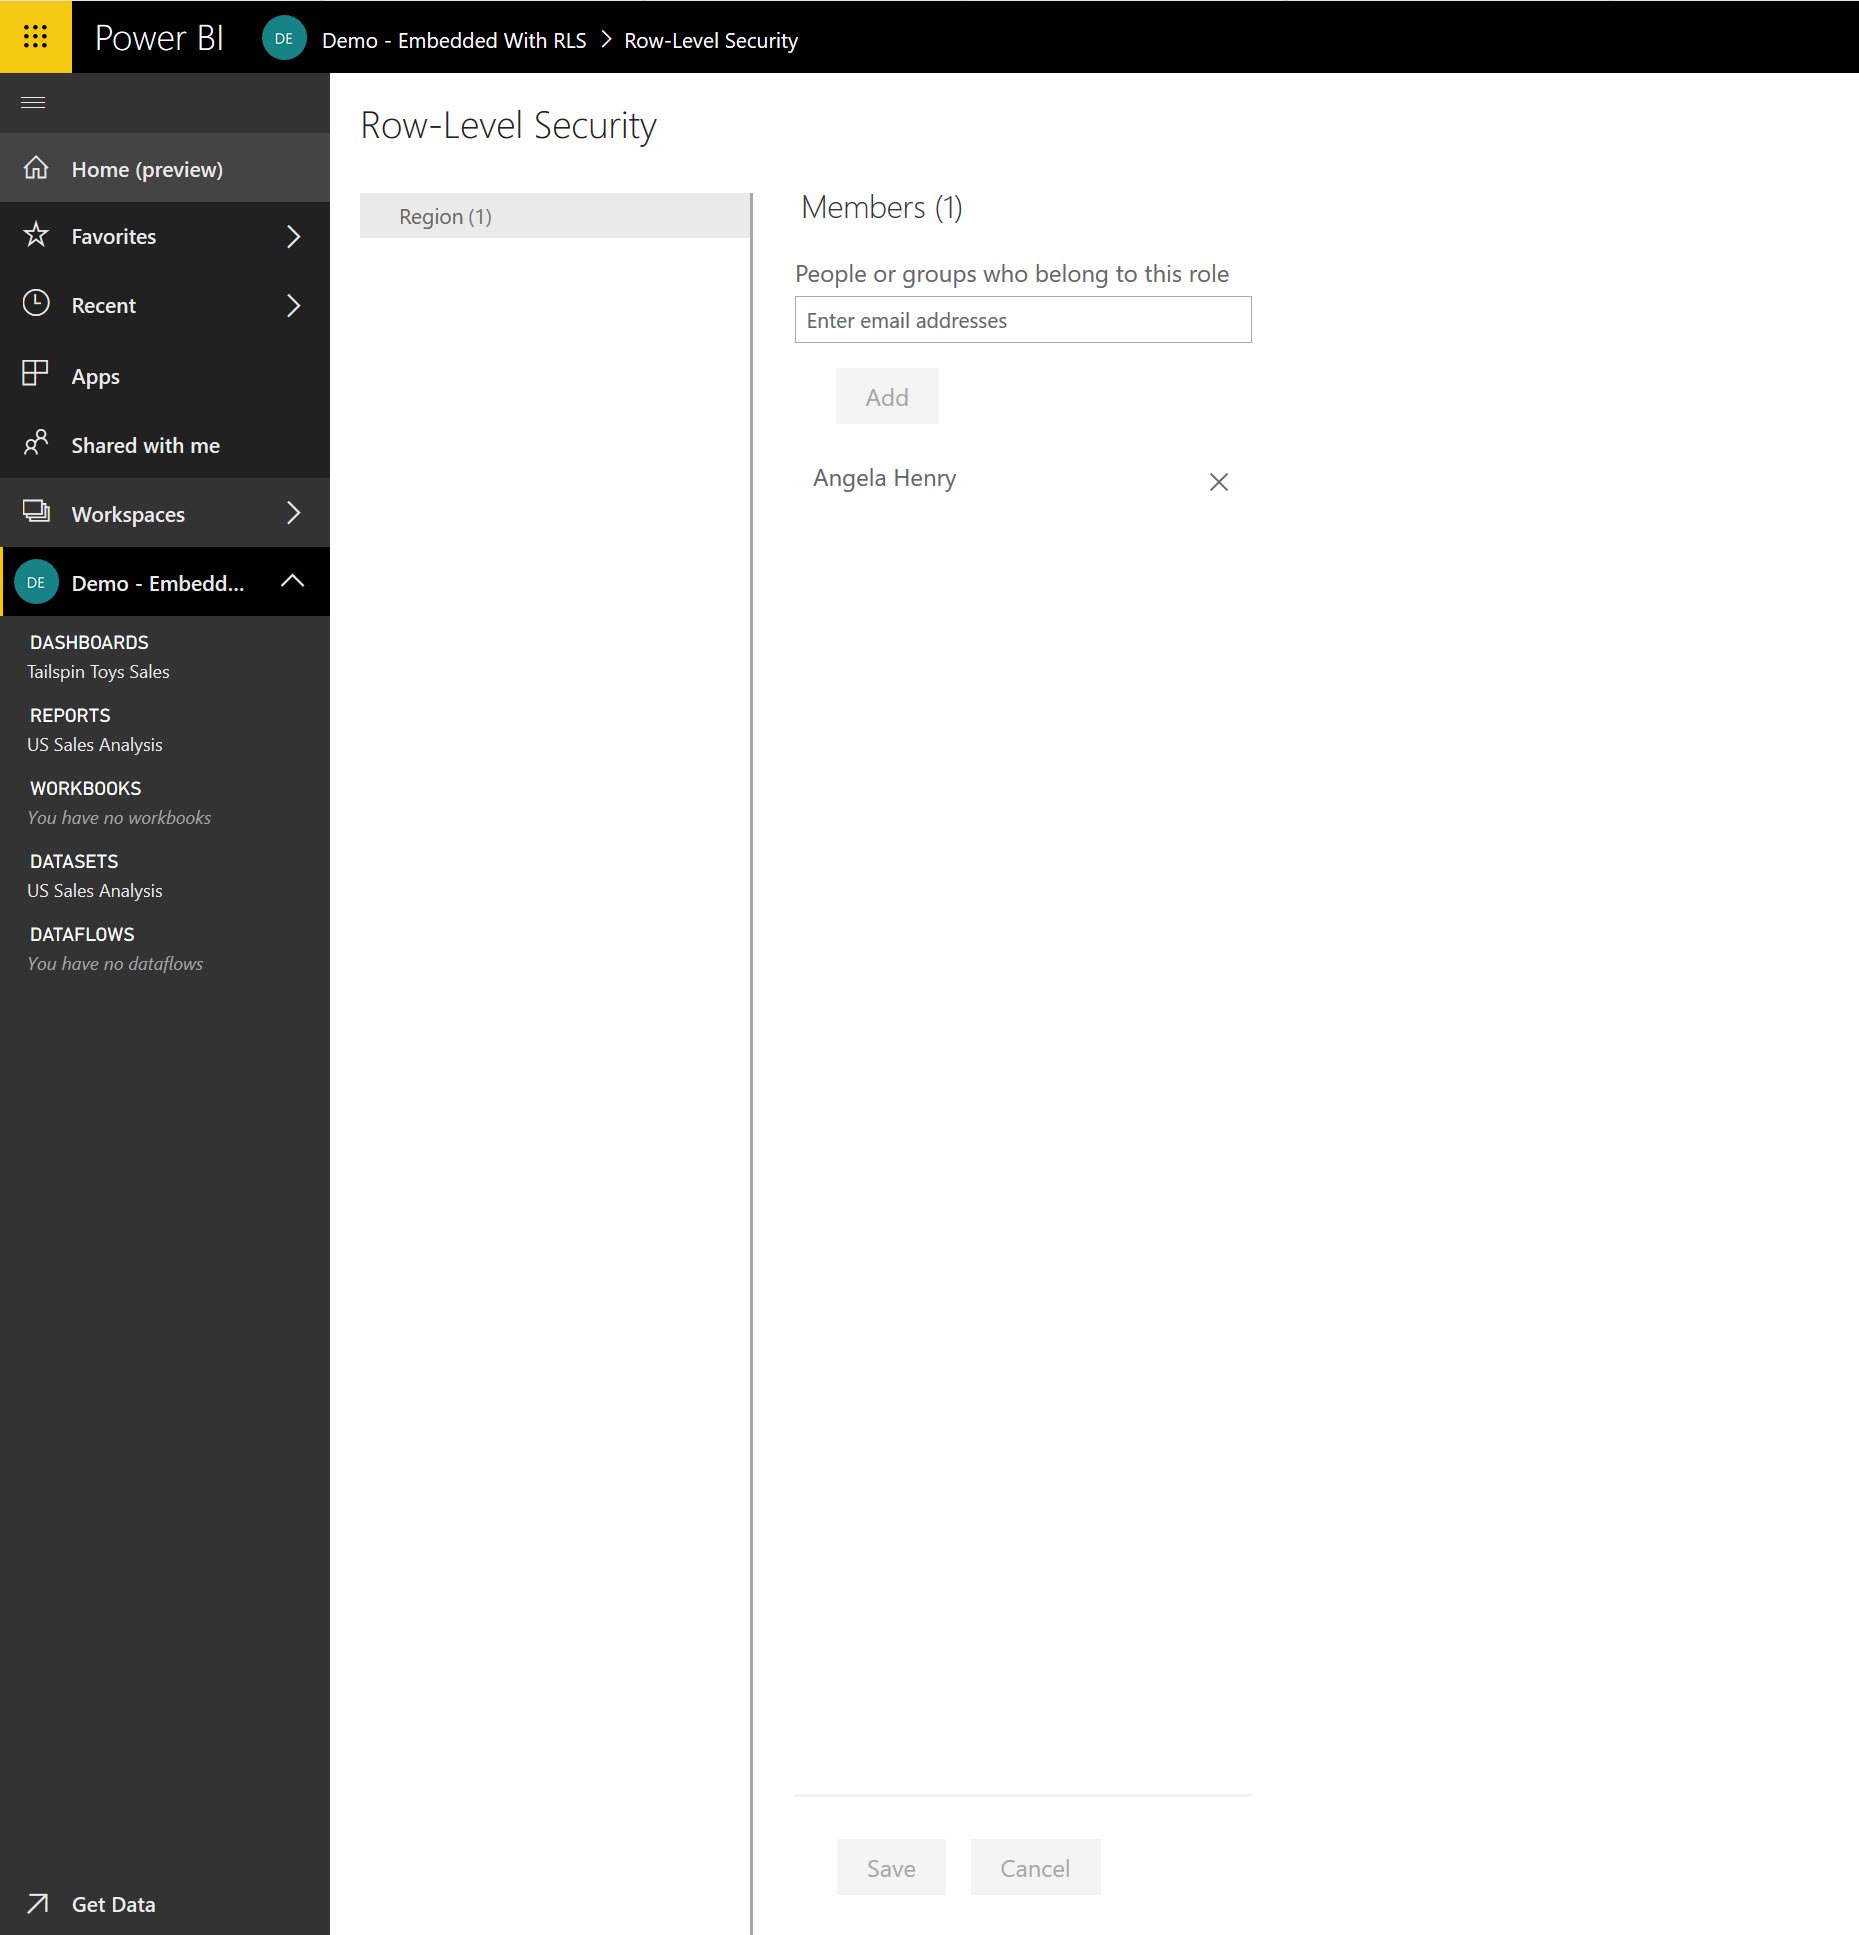
It should look like this now

Embedded-Sample-Final-Role

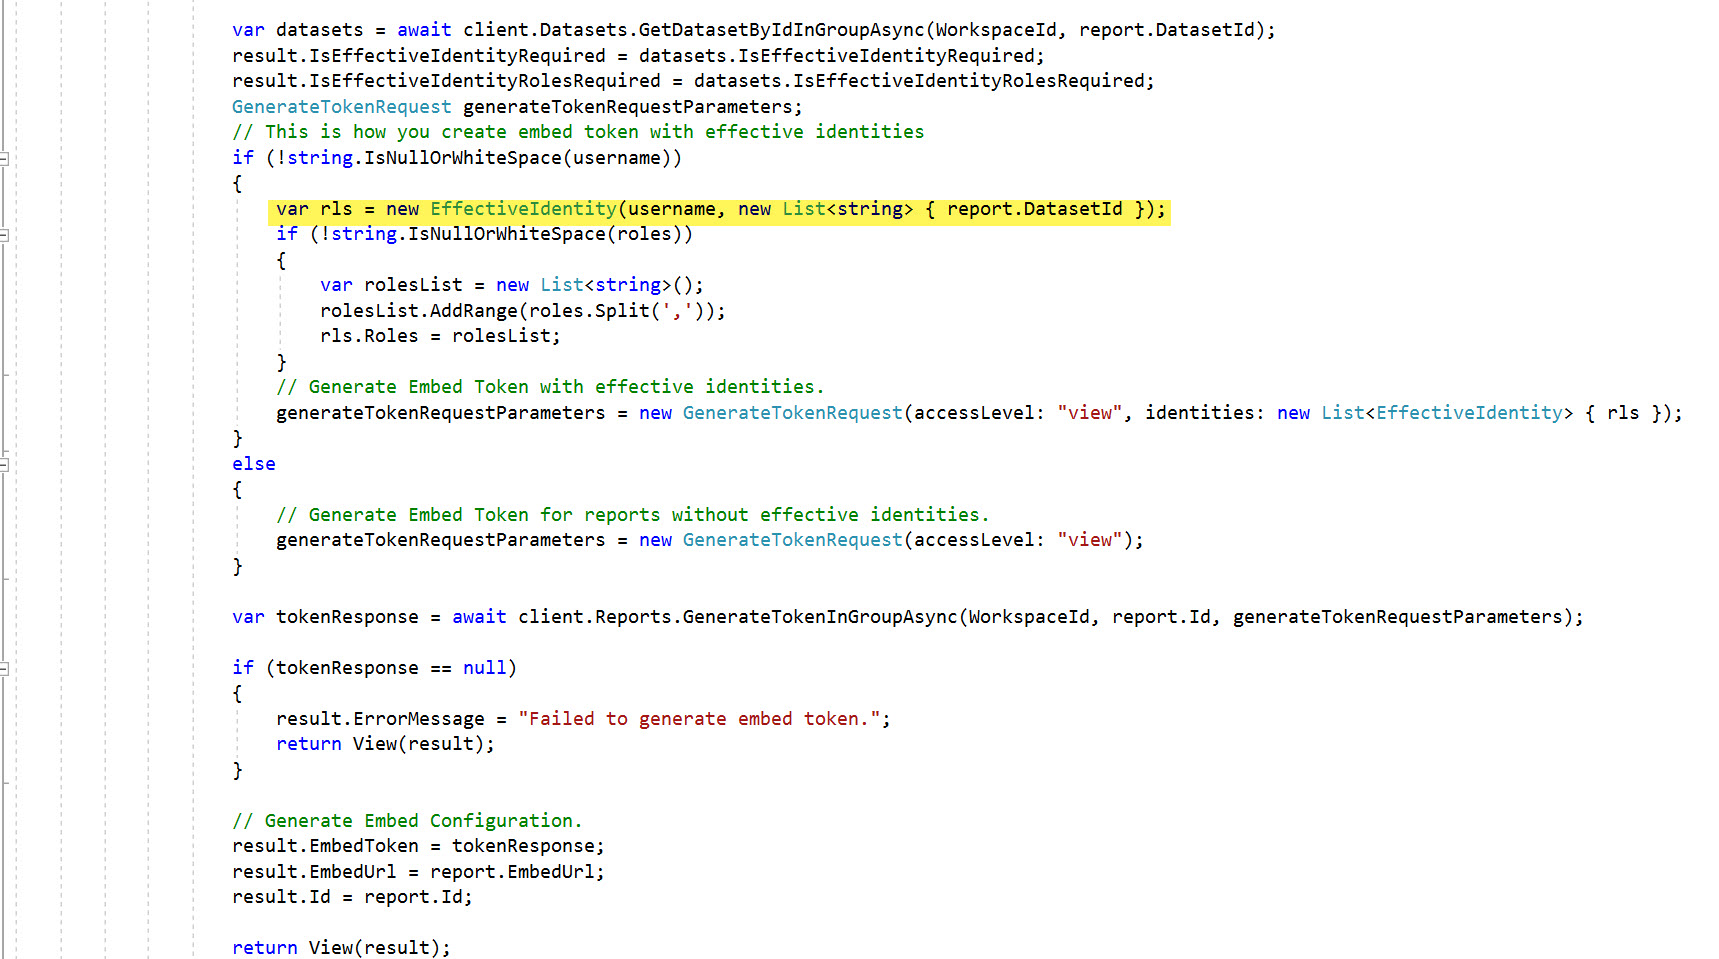
Now, let’s look at the sample web app and how this will work.  In the homecontroller.cs there is a call to EmbedReport which contains the creation of the EffectiveIdentity, this is where the magic happens.

Embedded-Sample-Effective-Identity

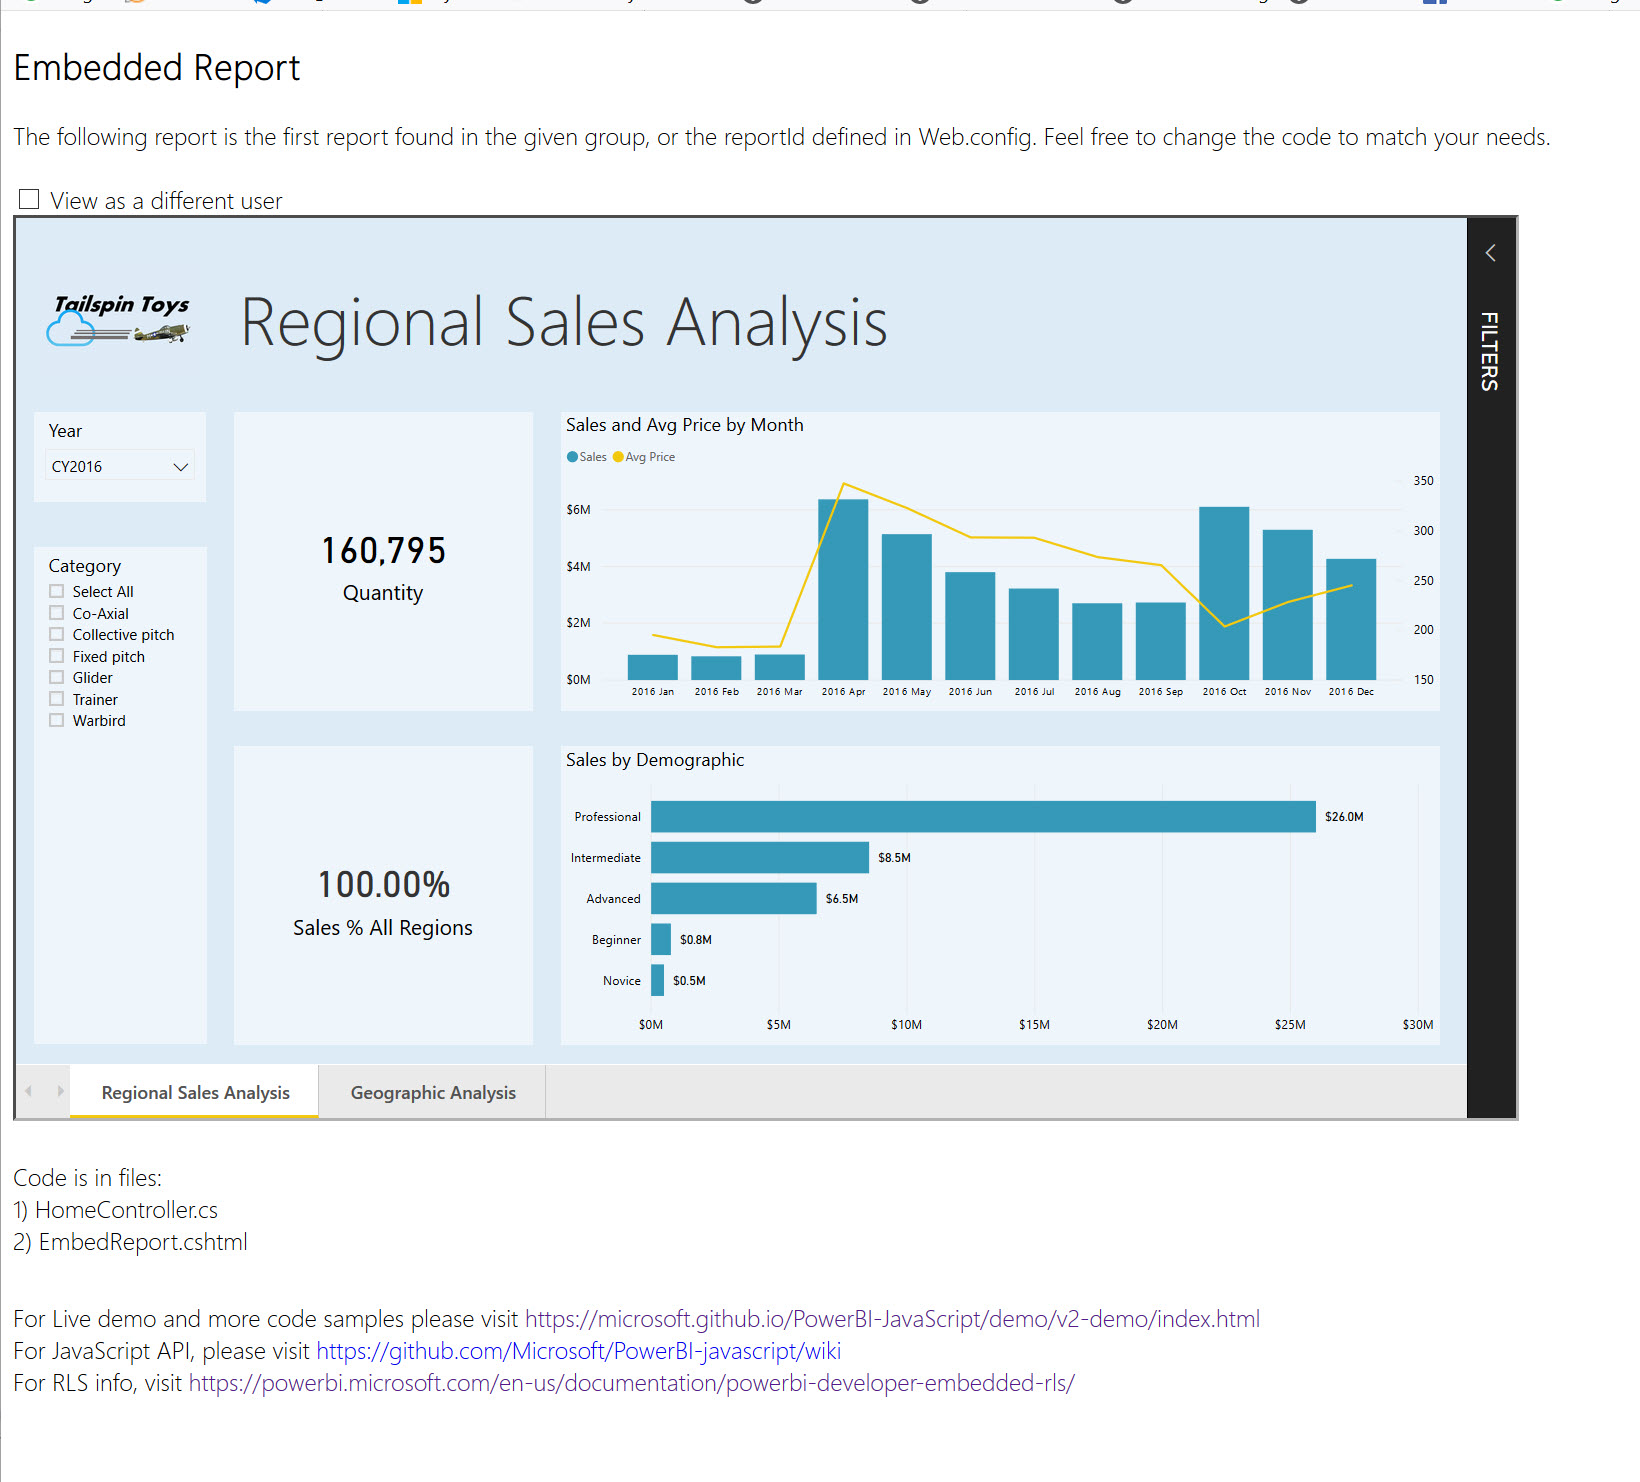
Let’s take a look at how this works from the front end.  Here’s my report with no security.

Embedded-Sample-No-Security

Now I just click the checkbox View as a different user, enter my values then click Reload.

Embedded-Sample-Filtered-Result

Presto change-o, the data is filtered for just the Midwest Region.  But wait, Midwest isn’t a Power BI user, so how does that work?  Again, the EffectiveIdentity overwrites the Username() function and applies whatever you have entered.  It’s magic, I’m telling you.

One thing that tripped me up was that I wanted to filter by RegionID, not region name.  When we work with data, we want to be as precise as possible so we typically use a primary key (or other unique identifier) to filter our data.  However I have discovered through trial and error that you cannot pass a number, you have to pass character data in order for the filter to work.  This means for your data you may need to ensure that there is some unique character data field to identify your customers other than a numeric ID field.

Oh, and if you want to play around with this you can use the sample app from Github and this Power BI Desktop file.

I hope this was helpful.

Update: 2-Feb-2019

I was asked an interesting question via Twitter by Dave Ruijter about converting data to string so you could essentially still use the numeric ID field.

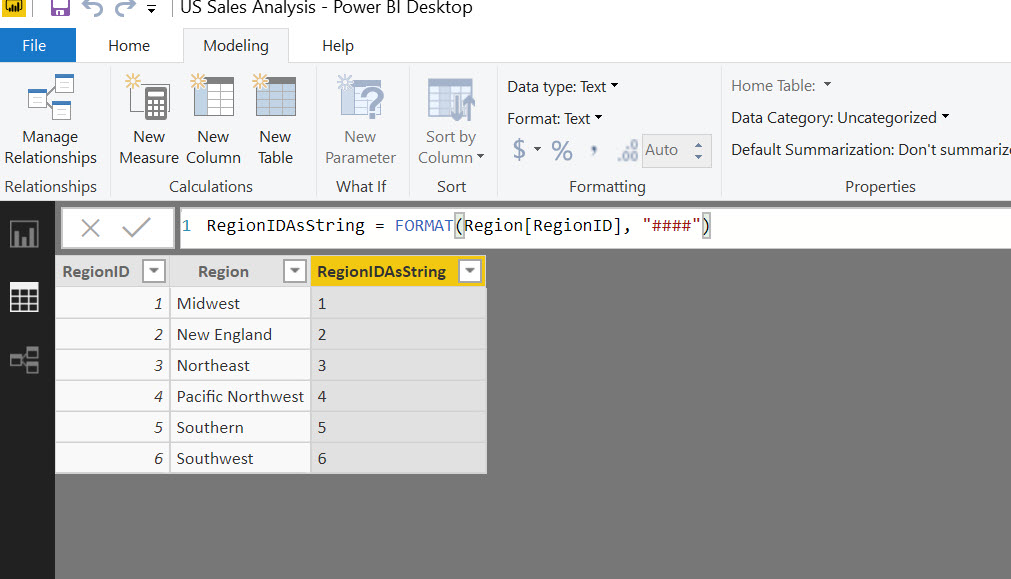
Instead I added a computed column to my dataset that uses the FORMAT() function to convert the existing numeric ID field to a string.

Embedded-Sample-New-Computed-Column

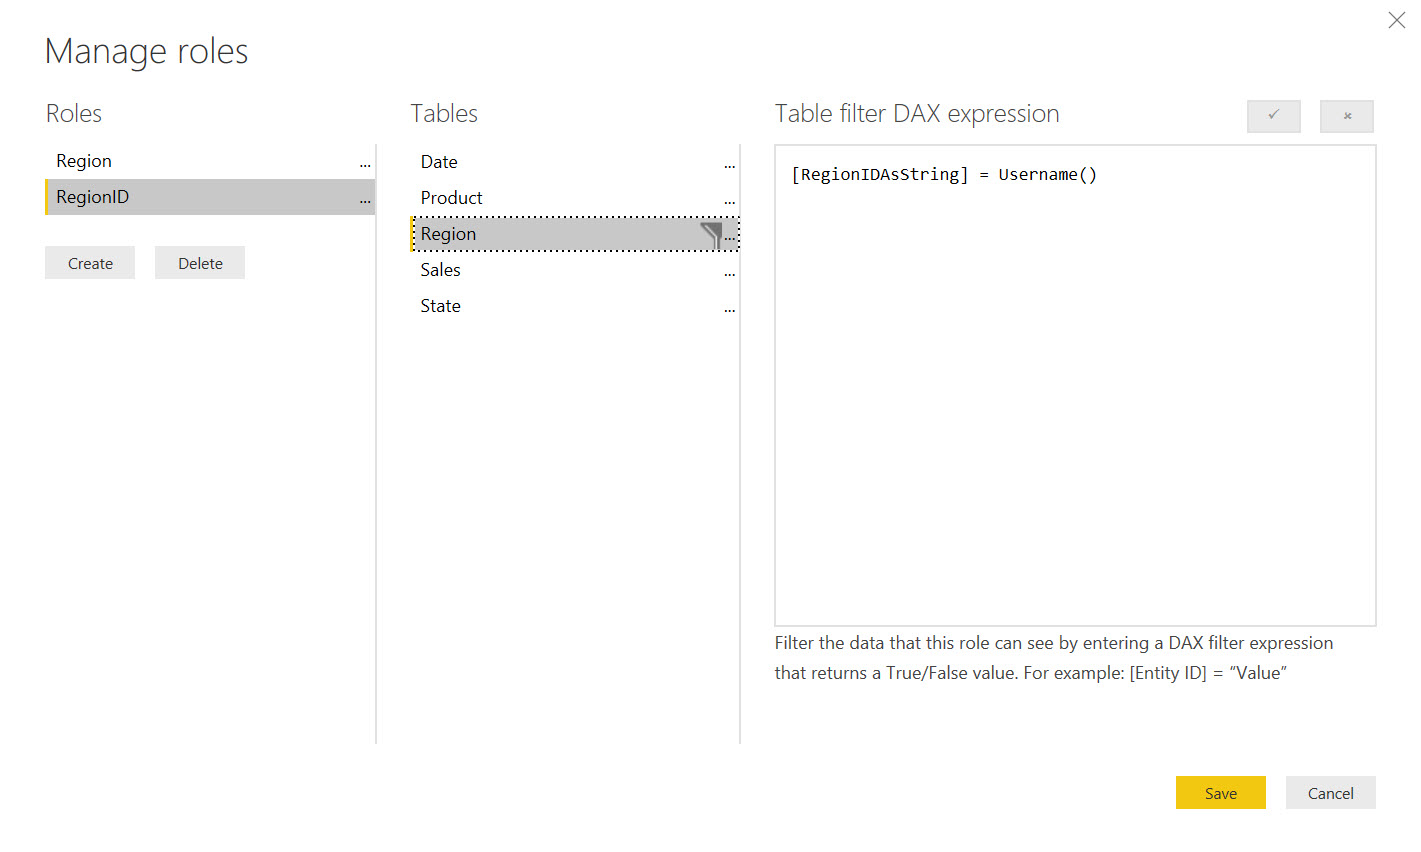
Then I based my role on that column, still using the Username() function.

Embedded-Sample-Using-RegionID-Role

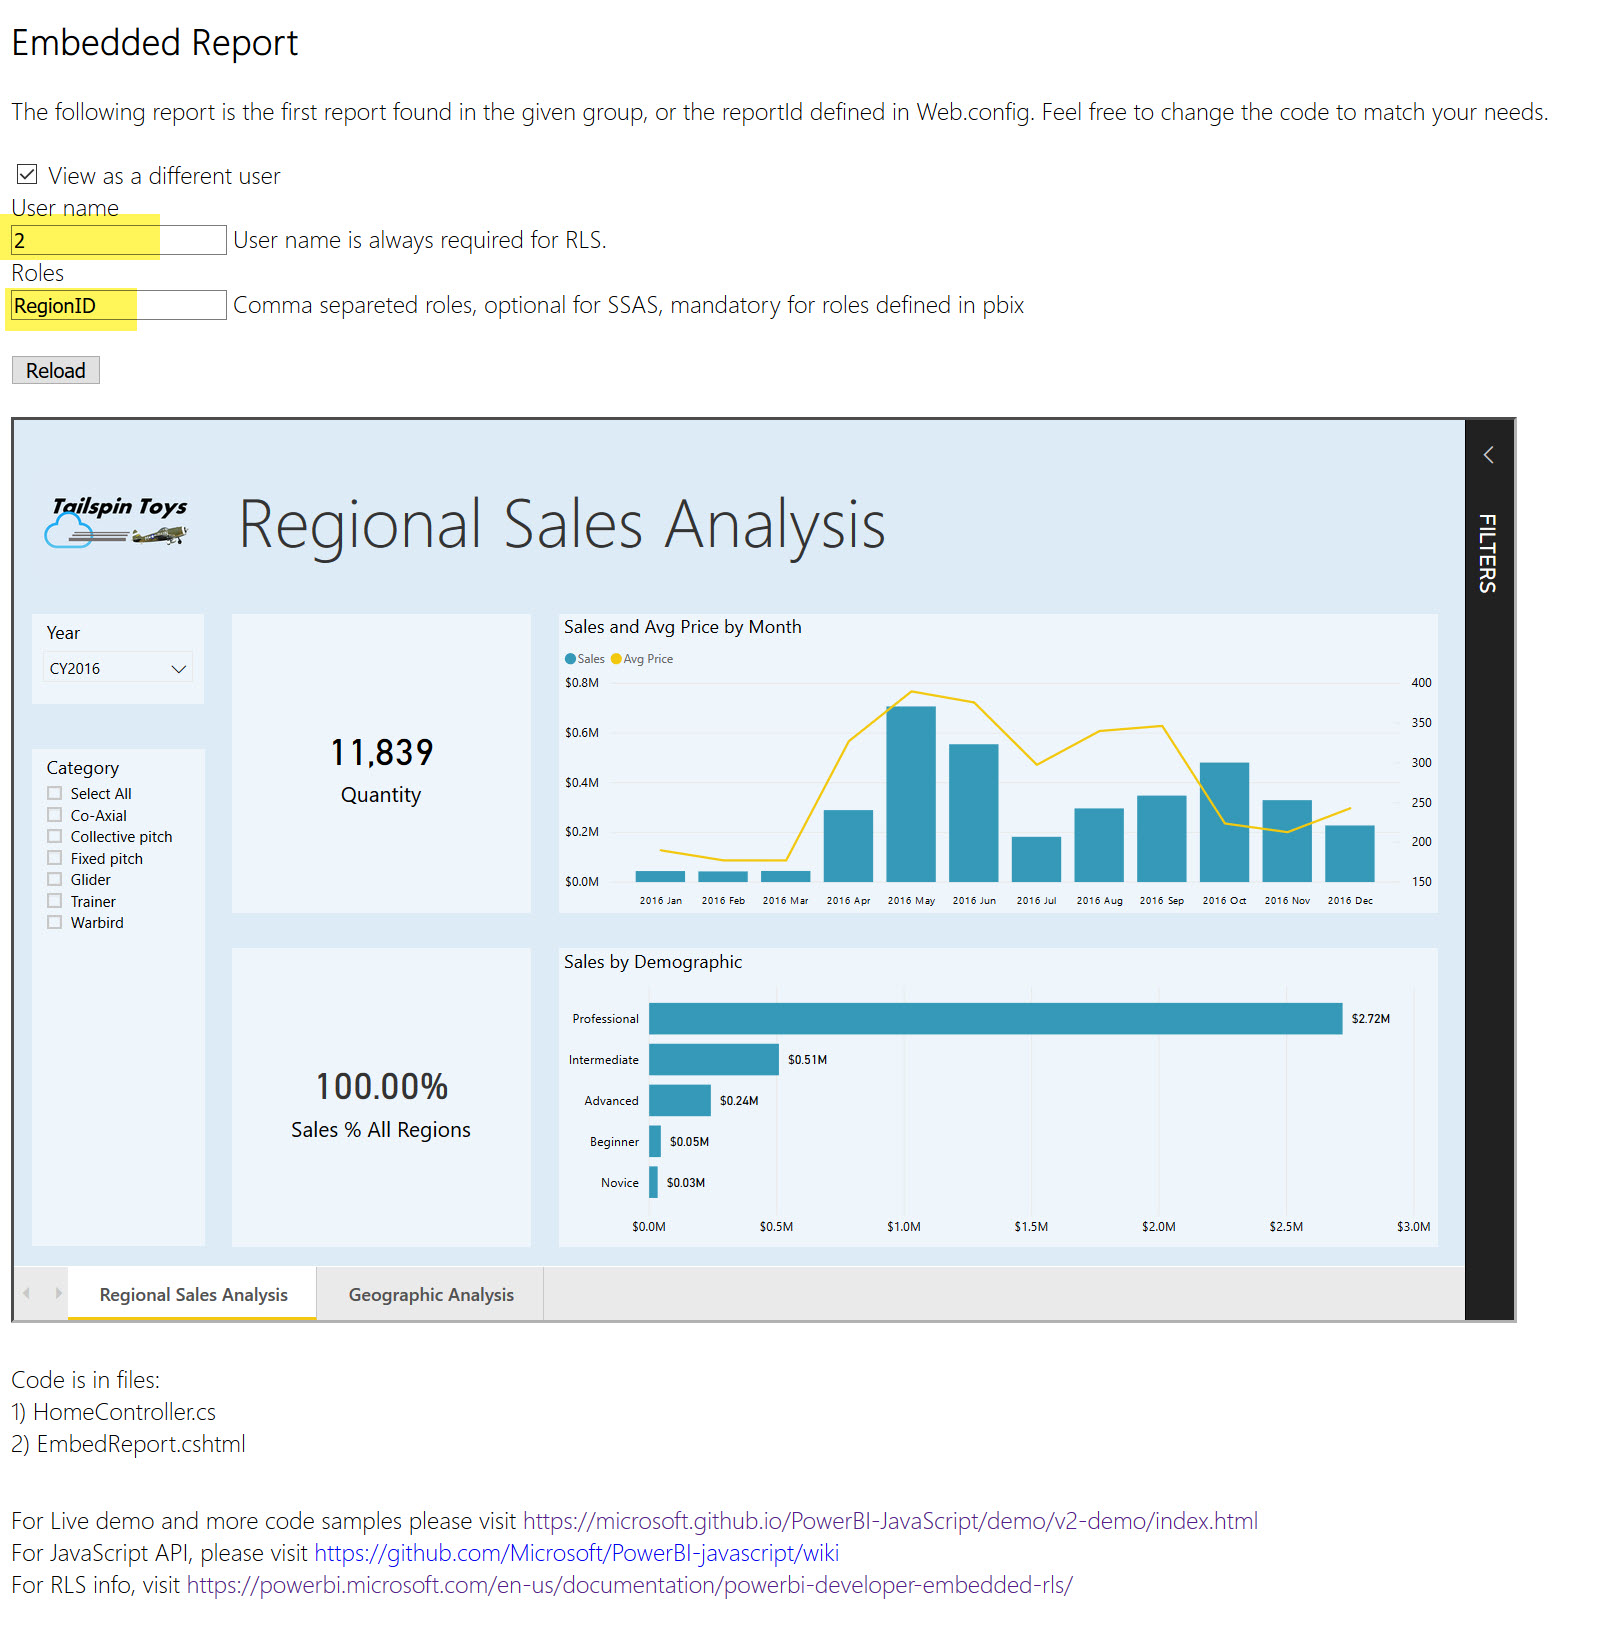
Now I can filter based on the ID field, WooHoo!

Embedded-Sample-Final-Using-RegionID

Thanks Dave Ruijter for making me think about this a little bit more.

Power BI World Tour Is Coming to Charlotte

If you haven’t heard, Power BI is doing a world tour, eight cities in four months and Charlotte, NC is one of those stops.  The Power BI World Tour is coming to Charlotte on August 27, 2018, and I will be speaking at this event!

I will be presenting my What is Power BI? session on Tuesday, August 28, 2018.  The Power BI World Tour is hosted by the local Power BI User Group (PUG) which means you will be getting premium Power BI content by local industry experts.  There’s still time to register, but hurry as seats are limited.

Hope to see you soon in Charlotte!

2018-PBI-WT-speaker-card-template