Lately, I’ve been having to create items in Power BI, that I haven’t had to do for a while, this week it was a Time table. Of course, I don’t do this often enough, so I had to search the dark corners of my mind, eventually gave up and used Google. I am documenting this here for my poor memory, but I figured it could probably help others as well, as I had to use a couple of articles to jog my memory. Now it’s all in one place for future reference. You’re welcome 😁
There are some instances when you want to analyze data over time, not just dates. Most of us are familiar with having to create date tables and use them in analysis, but having to analyze data over time is not as common. Let’s say you run a taxi company and you want to determine when your busiest times of day are. This would come in handy for scheduling drivers. You need more drivers during busy times because no one wants to wait for a taxi!
My example creates a time table down to the minute. You can definitely go more granular, but then you will end up with a time table with 86,400 rows (24 hrs * 60 mins * 60 secs) if you go down to the second. My time table will have 1440 rows (24 hrs * 60 mins).
Some might ask about creating this in Power Query using M. That is a perfectly valid approach, and I encourage it when you can, but you can’t always do that based on your data model data sources and storage modes, which is what I ran into this week. If you want to use Power Query to create your time table, check out this video by Wyn Hopkins on YouTube. He does a great job explaining it.
Now, on to the task at hand. Creating a time table using DAX. I do want to say that in order to use this time table for analysis, your data will need to have a column that can join to the time table. Because I am going down to the minute level, your data will have to have data at the minute level as well.
Here is the high level list of steps to create the time table, if this is enough for you, then you can stop reading now. However, if you want the details of each step, keep reading. I will also make all the DAX available via my github repo.
- Create Transaction Time table
- Add Time to the Minute column
- Change Time to the Minute column data type to Time
- Add time slot column
- Change time slot column data type to Time
- Repeat steps 4 & 5 until you have all the time slots you want
Step 1 – Create Transaction Time Table
In your Power BI Desktop file, if you switch to the Data view tab on the left side, you will see the menu changes. From this new menu, select New table. You will be prompted to enter some DAX. I am using the GenerateSeries() function. The DAX for this step is
Transaction Time = GENERATESERIES(0, 1439, 1)
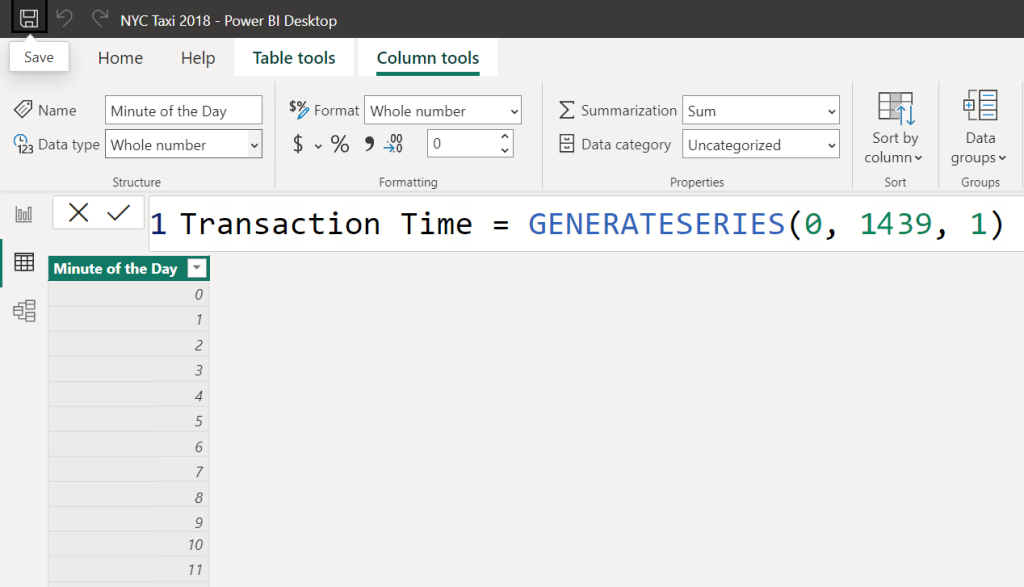
Now change the default column name to Minute of the Day. You’ll see a column of integers from 0 to 1439 for a total of 1,440 rows.
Step 2 – Add Time to the Minute column
Now we need to turn the Minute of the Day column to an actual time, so we need to add a new column, Time to the Minute. The DAX for this uses a formula to convert the column Minute of the Day to a time value. The Time function takes 3 parameters, Hour, Minute, and Second, respectively. For the Hour, we use the FLOOR function to get the hour of the day by dividing the Minute of the Day by 60 (60 minutes in an hour). For the Minute, we use the MOD function to get the remainder of minutes when we divide by 60 (again, 60 minutes in an hour). For the Second, we use 0 since we are not going down to that granularity.
The DAX for this column is (apologies for the hideously formatted DAX)
Time to the Minute =
TIMEVALUE(
TIME(
FLOOR(‘Transaction Time'[Minute of the Day]/60, 1),
MOD(‘Transaction Time'[Minute of the Day], 60),
0
)
)
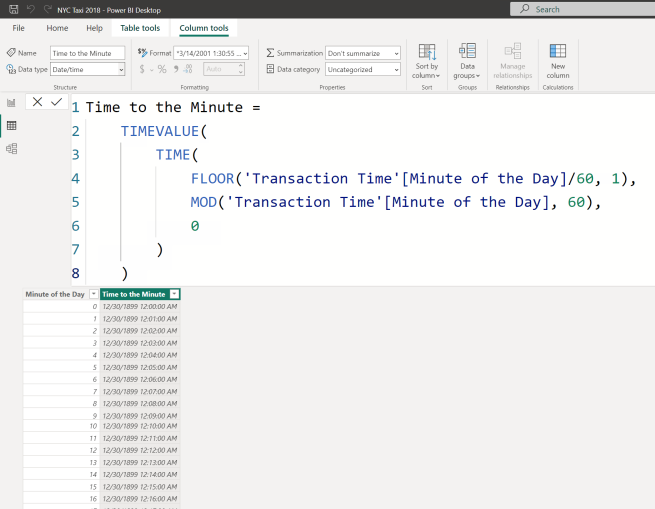
Step 3 – Change Time to the Minute column data type to Time
By default, our new Time to the Minute column was added as datetime data type. Not only that but the default date is 12/30/1899 – Yikes! We need to convert it to a Time data type. From the Data type dropdown, select Time.
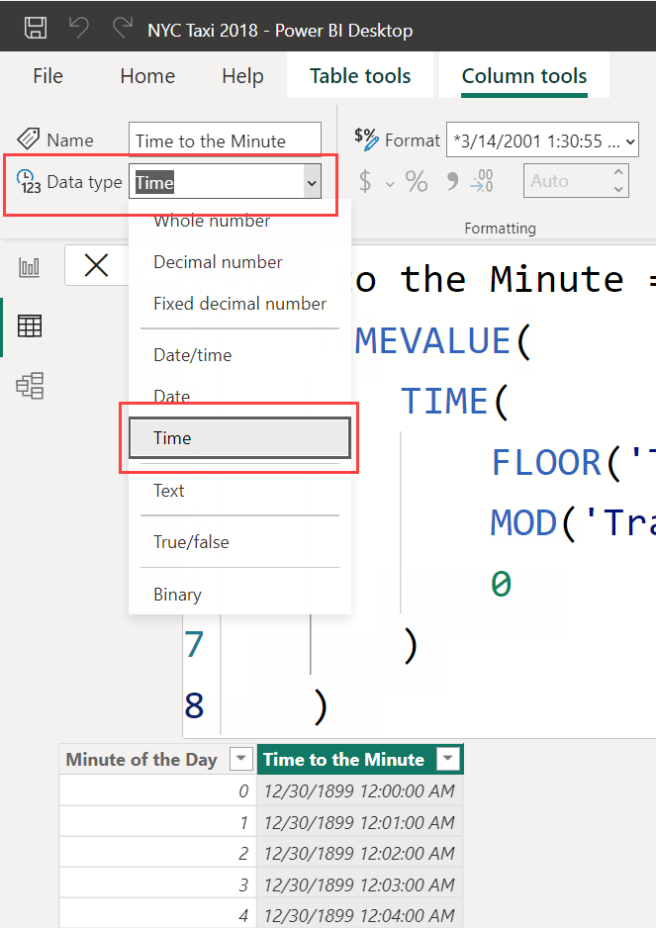
and you can see that the date is no longer part of the column, we only have a time value now.

Step 4 – Add time slot column
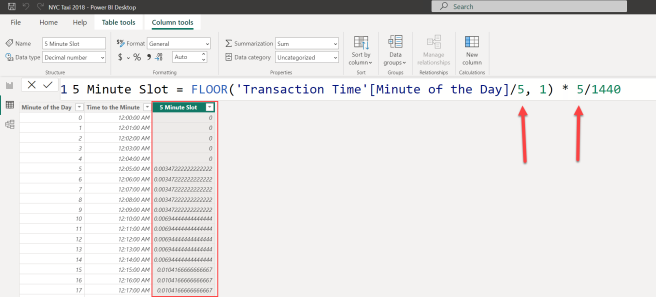
Now we need to create the time slot column(s) that we are going to use in our model. I’ll start with my generic DAX pattern of X minutes, then replace X with my value. Add a new column and use the following DAX for the column
X Minute Slot = FLOOR(‘Transaction Time'[Minute of the Day]/X, 1) * X/1440

I am going to need a 5 minute time slot, so I will replace all the X values with 5,
Step 5 – Change time slot column data type to Time
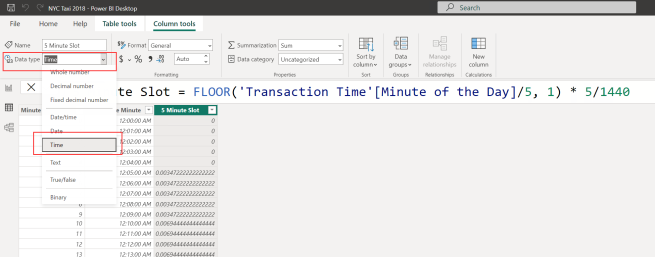
You’ll notice that we now have a decimal value for our 5 Minute Slot column. That’s not very helpful, so we need to change the data type to Time from the Data type dropdown.
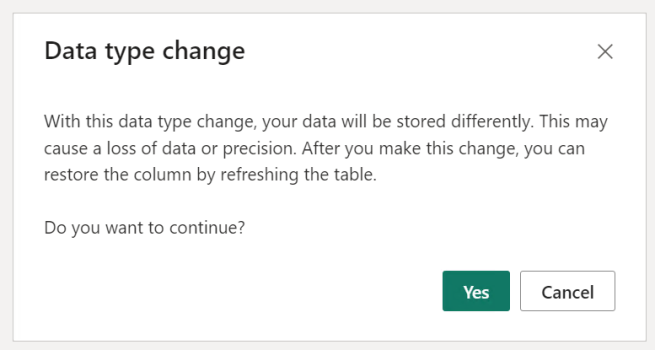
You will get a prompt about Data type change. You will need to click Yes to change your new column to a Time data type.
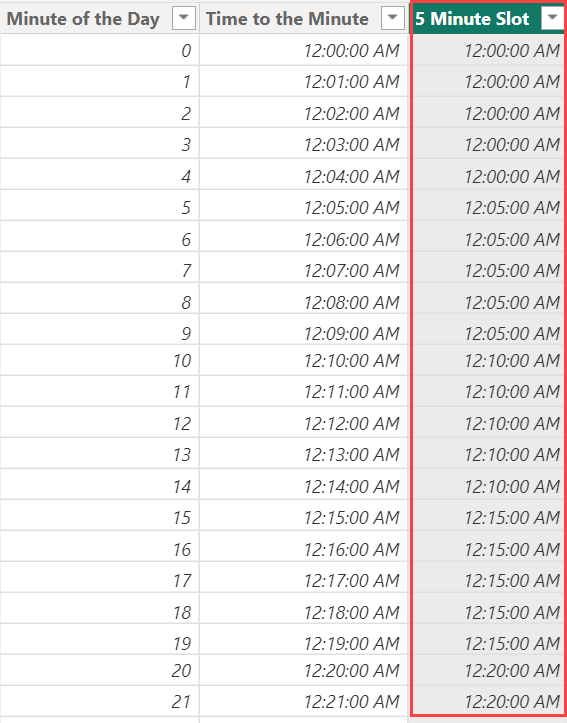
And now we have a lovely column of time values. Notice how the values repeat for every 5 rows, then change to the next time. This is because we used FLOOR function.
Step 6 – Repeat steps 4 & 5 until you have all the time slots you want
Now repeat steps 4 & 5 until you have all the time slot columns you want. Here is my time table with the final time slot columns.
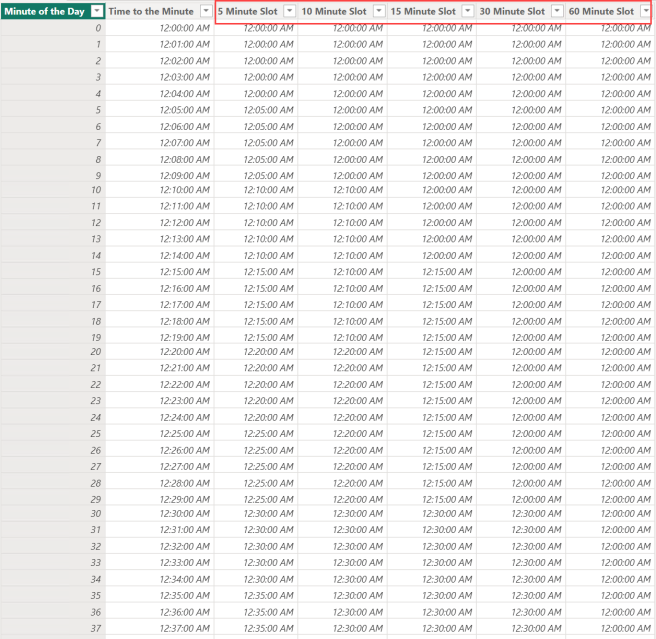
I have 5, 10, 15, 30, and 60 minute slot columns.
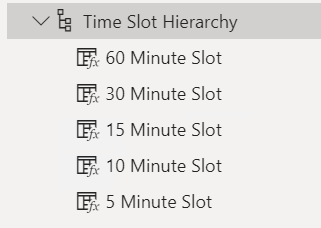
If you want to go the extra mile, you can create a hierarchy for the time slots, this is what mine looks like.
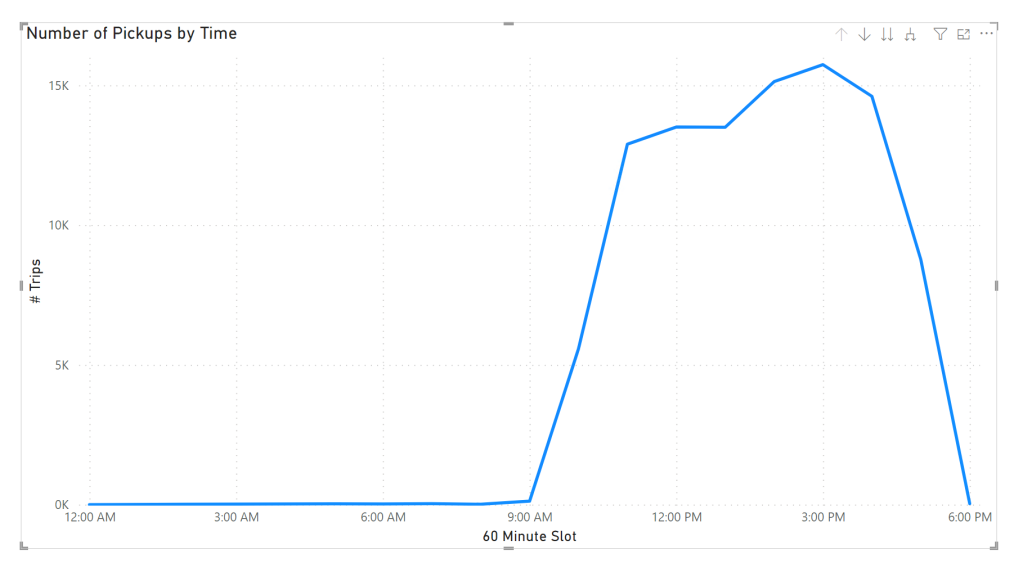
I know what you’re thinking, “How do I use this in a visual?”, well, I used a line chart to track the pickup of my taxis. It looks like this.
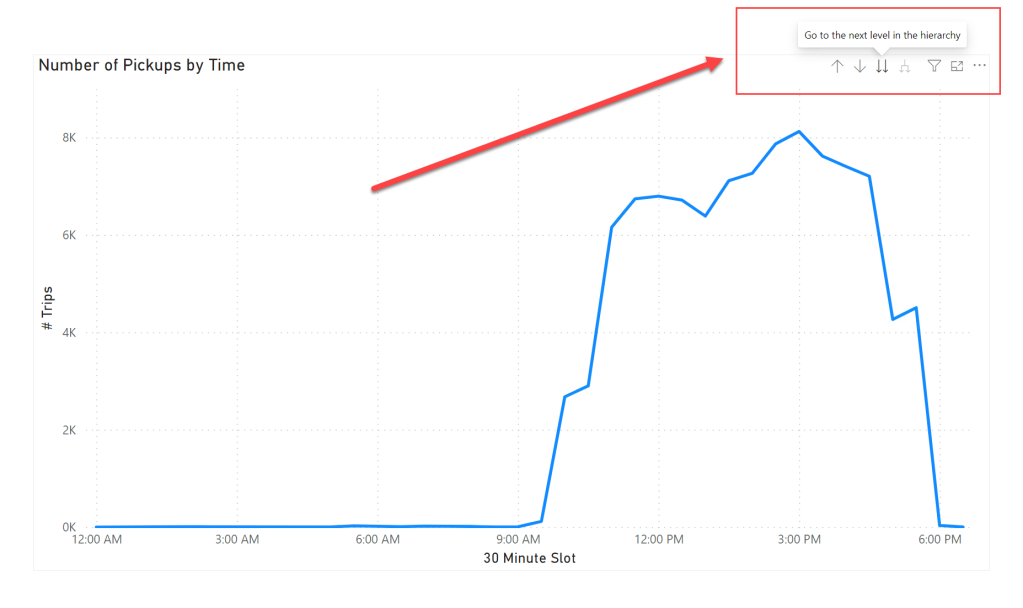
You can use the hierarchy to allow for better analysis, my only suggestion is to use the “go to next level” of drill down (the 2 arrows pointing down) instead of “expand to next level” (the forked down arrow) for a better experience.
That’s it, you now have a Time table and a hierarchy for better analysis over time.
